
In US real estate, investment strategies are commonly sorted along a single spectrum that runs from lowest risk to highest risk. The four categories — Core, Core-Plus, Value-Add, and Opportunistic — describe how much risk an investor takes on, how returns are generated, how much debt is typically used, and how actively the asset must be managed. Understanding this framework is the foundation for reading almost any US real estate deal, because sponsors and institutional investors use these labels as shorthand for the entire business plan behind a property.
This guide walks through each strategy in order, from the most conservative to the most aggressive, along with the key factors that define each one. The figures below are general industry reference ranges, not fixed rules — actual returns, leverage, and cap rates vary widely by market, property type, asset quality, and the point in the economic cycle.
Core: The Foundation
Core is the lowest-risk strategy on the spectrum. It focuses on high-quality, stabilized properties, typically Class A assets in prime locations within major metropolitan markets. These properties are usually fully or near-fully leased, often in the 90%+ occupancy range, and secured by creditworthy tenants on long-term leases.
The defining feature of Core investing is that most of the return comes from stable, predictable rental income rather than from increasing the property's value. Because the income stream is so reliable, Core assets are often compared to bonds. Investors buy them for steady cash flow and capital preservation rather than for aggressive growth.
Core strategies use conservative leverage, commonly in the range of roughly 40–50% of the property's value. This lower debt level reduces financing risk and helps the asset perform consistently across business cycles. The trade-off is lower returns: Core investments generally target annual returns in the high single digits, often cited around 7–10%. A frequently used illustration of a Core asset is a national pharmacy or retail store on a long-term lease in an established location, an asset that requires little active management and produces dependable income.
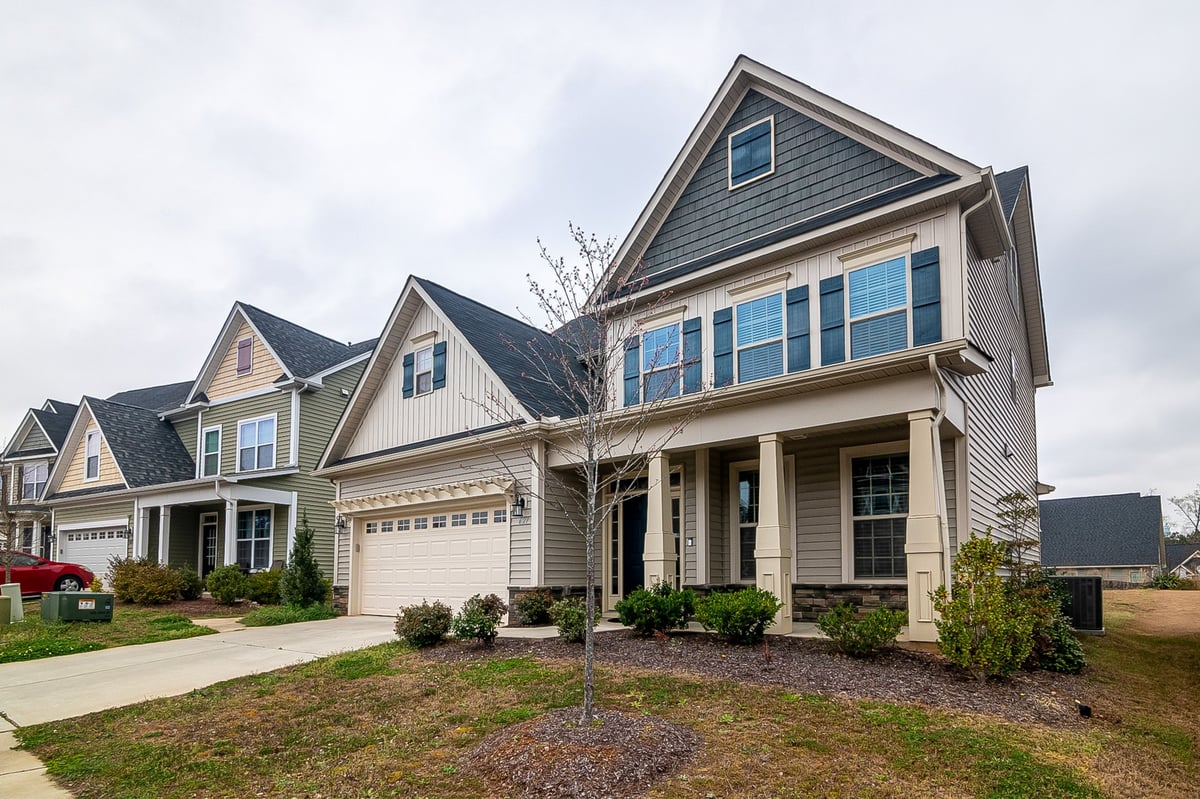
Stabilized, well-located residential assets like this one anchor the Core end of the risk spectrum
Key factors that define Core: high-quality stabilized assets, prime locations, strong tenants, long leases, low leverage, income-driven returns, and minimal active management.
Core-Plus: Income with a Little Growth
Core-Plus is a modest step up in risk from Core. It targets similar high-quality properties but accepts slightly more risk in exchange for slightly higher returns. The assets are still fundamentally stable and income-producing, but there is usually some opportunity to enhance value through light improvements, better management, or more proactive leasing.
Core-Plus investors often use somewhat more leverage than Core investors, which is one of the main levers that raises both the potential return and the risk. Returns are still largely income-driven, but a portion now comes from modest value growth. Target returns for Core-Plus are commonly cited in the low-teens range, often around 12–15% depending on the source and property type.

High-quality, modern assets in strong markets are the typical Core-Plus targets
In practical terms, a Core-Plus property might be a well-located building that is stable but slightly under-managed, or one where lease terms can be improved over time. The strategy sits comfortably between the bond-like stability of Core and the more hands-on execution required further up the spectrum.
Key factors that define Core-Plus: stable assets with light upside, modest improvements, somewhat higher leverage, a blend of income and growth, and a low-to-moderate risk profile.
Value-Add: Fixing and Improving
Value-Add is where the strategy shifts from owning stable income to actively creating value. These investments typically involve properties with operational problems or unrealized potential — a building with below-market occupancy, deferred maintenance, dated interiors, or inefficient management. The sponsor's job is to fix those problems and, in doing so, raise the property's income and value.
The business plan is central here. A typical Value-Add scenario might involve acquiring an office or apartment property with occupancy well below market, investing capital into physical improvements and better management, backfilling vacant space, and bringing rents up to market levels over two to three years. When executed well, occupancy climbs, income rises, and the property can be sold at a higher value.
Value-Add uses higher leverage than Core or Core-Plus, which amplifies both gains and losses. Because the returns depend on successfully executing renovations and leasing, this strategy carries meaningful execution risk. Holding periods are typically longer — commonly five to seven years — to allow the business plan to play out. Target returns are generally cited in the mid-to-high teens, often around 15–18% or higher, reflecting the added risk and active work involved. Acquisition cap rates for value-add assets are often quoted in the 6–8% range, reflecting the fact that the income is not yet stabilized.

Active facade and interior work is a hallmark of the Value-Add strategy — fixing problems to unlock income and value
Key factors that define Value-Add: underperforming or dated assets, capital improvements, active repositioning, higher leverage, execution risk, and returns driven substantially by capital gains rather than income alone.
Opportunistic: The Highest Risk and Reward
Opportunistic is the highest-risk category on the spectrum. These investments typically involve ground-up development, major repositioning of a distressed asset, or complex situations where there may be little or no income for an extended period. Returns come almost entirely from capital appreciation rather than from ongoing cash flow, and in many cases the investor receives no income at all until the project is completed and leased.
Opportunistic deals often stack multiple risks at once — development risk, construction risk, leasing risk, and market timing risk — and require all of them to align for the projected return to materialize. An example might involve acquiring a largely vacant building at distressed pricing, redeveloping it into a different or mixed use, investing substantial capital over several years, and executing a leasing program before selling. Because so much can go wrong, these strategies demand deep operational expertise.
This category typically uses the highest leverage of the four, which maximizes potential return but also magnifies downside if the plan falters. For certain project types, such as land or ground-up development, lenders may cap how much they will finance, meaning investors must commit significant equity up front. Target returns are the highest on the spectrum, frequently cited at 20% or more, contingent entirely on successful execution.

Ground-up construction sites like this one sit firmly in the Opportunistic category — high execution risk, no in-place income

Raw, undeveloped land is the canonical Opportunistic asset — long timelines, high equity requirements, returns come from the build-out itself
Key factors that define Opportunistic: development or major repositioning, little or no in-place income, the highest leverage, stacked execution and market risks, long timelines, and returns generated almost entirely from capital gains.
Reading the Spectrum as a Whole
The four strategies are best understood as a continuous scale rather than four separate boxes. As an investor moves from Core toward Opportunistic, several things increase together: the amount of risk, the amount of leverage typically used, the degree of active management required, the length of the holding period, and the share of return that comes from capital appreciation rather than income. Moving in the other direction, from Opportunistic back toward Core, income becomes more important, leverage falls, and predictability rises.
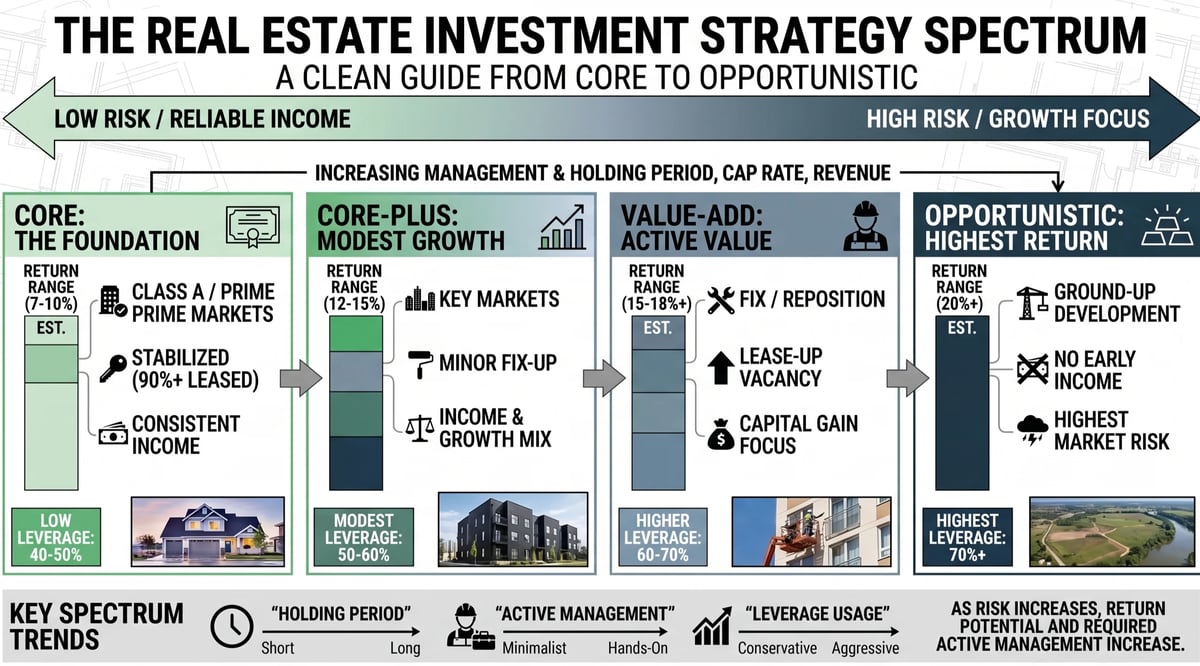
The full Core-to-Opportunistic spectrum at a glance — return range, leverage, and management intensity all increase together as risk rises
A few key factors cut across all four strategies and are worth watching in any US deal. Cap rate (capitalization rate) measures a property's income yield relative to its price and is a central tool for pricing assets — lower cap rates generally reflect lower-risk, higher-priced assets, while higher cap rates often signal more risk or less stabilized income. Leverage determines how much of the deal is financed with debt and heavily influences both returns and risk. Cash flow describes the income the property generates after expenses and debt service. Location and asset quality underpin everything, shaping tenant demand, rent growth, and resilience across cycles. The holding period and exit strategy determine when and how the investment is realized.
Together, these categories give investors, operators, and analysts a shared language for describing exactly what kind of risk a real estate investment carries and where its returns are expected to come from. The framework does not tell anyone which strategy is right — that depends entirely on an individual investor's goals, resources, expertise, and tolerance for risk — but it provides the map on which nearly every US real estate decision is plotted.
Disclaimer: Nothing in this article constitutes investment, legal, tax, or financial advice. The figures and ranges referenced are general industry reference points drawn from publicly available sources and will vary widely by market, property type, asset quality, and economic conditions. Anyone evaluating a real estate investment should rely on qualified professional advice and the specific deal documents for the opportunity in question.
Get In Touch
Contact Us
Article Written By
Martin Kocher
Managing Partner, Veridian Global Partners